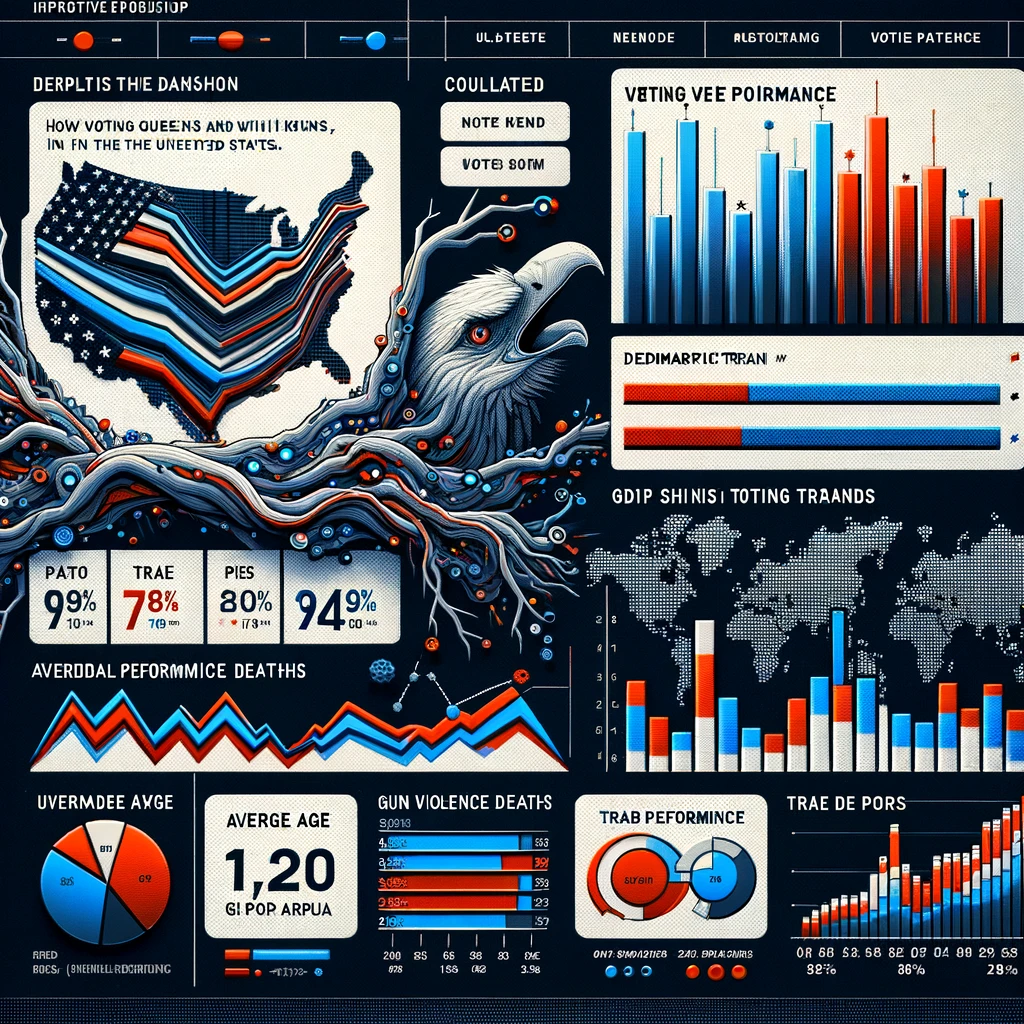
Voter Trend Analysis: Interactive Visualization of Voting Patterns in the USA

This project delves into the intricate dynamics of voting patterns in the United States through a series of sophisticated SQL queries. Leveraging a robust web interface built with Angular, users can input specific criteria to visualize how various factors influence voting outcomes over time.
Project Overview:
- Complex SQL Queries: Crafted six advanced SQL queries to analyze and understand the voting trends and their correlation with factors like US trade performance, average age, gun violence deaths, and state GDP per capita..
- Interactive Web Platform: Developed using Angular and Flask, the platform allows users to input their parameters (state, sector, time range) to generate dynamic visualizations of past voting trends.
- Data Integration and Analysis: Utilized raw SQL queries integrated with the Flask framework to pull data from multiple sources, providing a comprehensive view of the socio-economic factors affecting voting behaviors.
- Visualization of Data: Implemented sophisticated data visualization techniques to depict correlations and trends, enhancing user engagement and understanding of complex datasets.
This initiative not only advances the field of political data analysis but also equips voters, researchers, and policymakers with the tools to explore the nuanced effects of socio-economic factors on electoral outcomes.
